When developing our new tools, we followed a simple principle: data should help people, not overwhelm them. Our new generation of reporting brings clients significant strategic advantages.
HR managers get an instant overview of the data without having to manually connect dozens of spreadsheets. Artificial intelligence automatically prepares clear, board-ready summaries and frees HR professionals to focus on discussions with people and on implementing real change.
- No more endless searching: All key data is available in one interactive place: the dashboard. No more complicated searching through dozens of tables.
- Presentations for management in one click: Outputs are visually attractive and easy to understand. Presenting results to the board or managers has never been easier.
- Maximum time savings thanks to AI: Artificial intelligence does the heavy lifting for you—it analyzes data as well as thousands of open-ended comments and suggests specific next steps.
- Flexibility and personalization: The report adapts to whether you need a quick overview or a detailed analytical insight.
- Export to PDF and support for different languages remain a given. We can translate and localize reports into any language.
Take a closer look at all the technical improvements and features of TCC online Employee Surveys that you can start using right away.
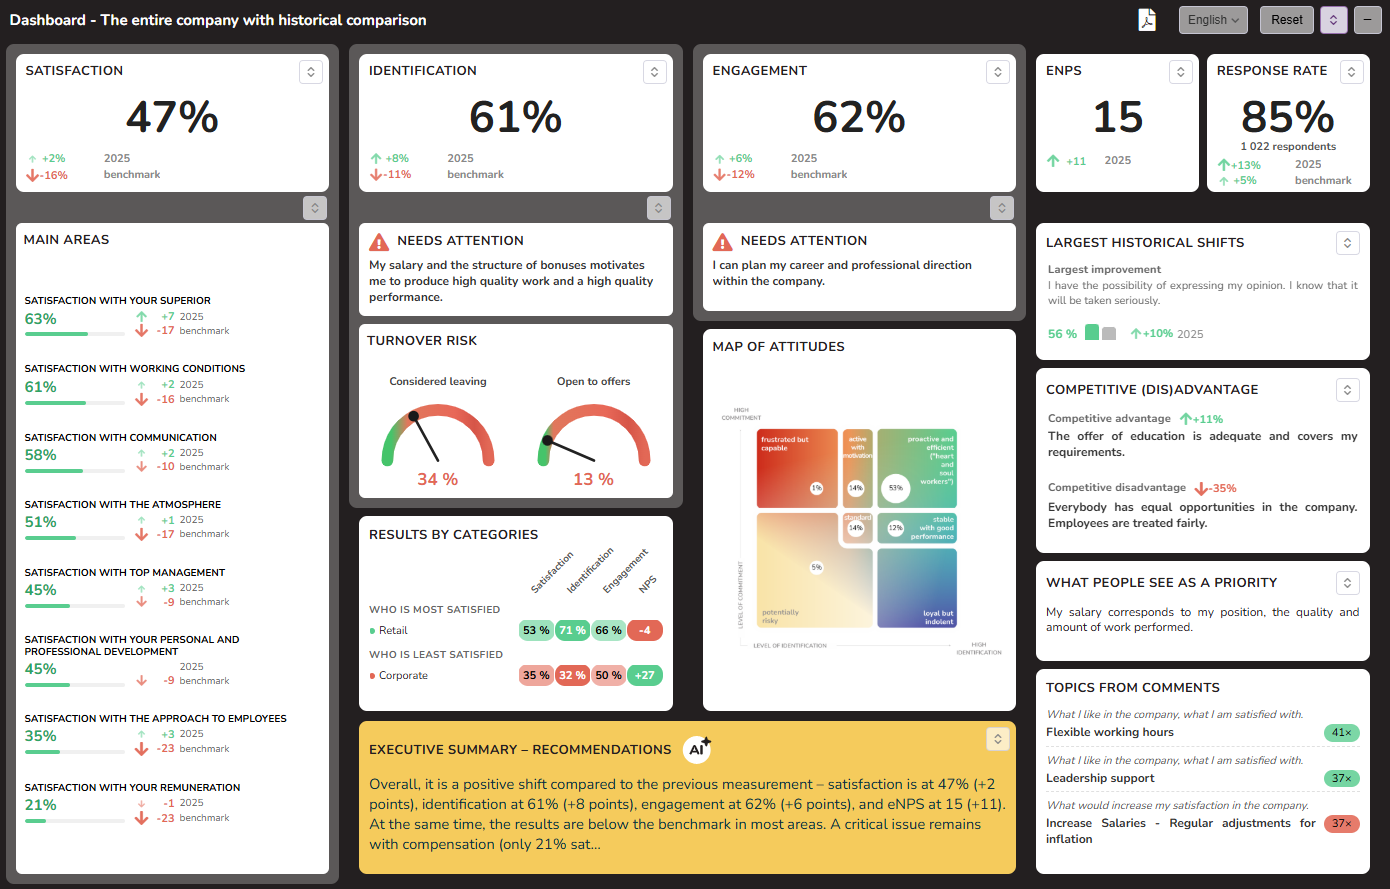
1. Online Interactive Dashboards: All Data in One Place
The foundation of the new ecosystem is an online interactive dashboard that works as an intelligent guide for quick orientation. Depending on your current needs or preferences, you can choose either a shorter or a more detailed view.
What can you find in one clear place?
- Key metrics: You can immediately see key indicators such as engagement, identification with the company, including the attitude map, overall satisfaction and its individual areas, eNPS (Employee Net Promoter Score), and response rate. For all metrics, you can also see trends over time.
- Impact analyses: The dashboard automatically shows which factors have the greatest real impact on employee identification, engagement, or, conversely, turnover.
- The most satisfied vs. at-risk groups: You can immediately identify the teams and employee groups with the best scores, as well as those that are critically at risk.
- Competitive advantages and disadvantages: You can see where you excel as an employer and where the market is ahead of you.
- The most significant improvements and declines: The system itself highlights the most pronounced shifts over time, both positive and negative.
- The voice of employees: A quick overview of what resonates in messages from people.
- Subjective importance: If the survey also maps how important a given area is to employees, the dashboard shows the priorities of your people.
2. Synergy Between Annual and Pulse Surveys: Action Tracking
Modern HR cannot function without continuous feedback. Our reports can connect data from comprehensive annual surveys and short pulse surveys.
This means that a large annual survey can easily be followed by shorter pulse waves for action tracking, i.e. monitoring the impact of implemented measures. While the annual version tracks the overall health of the company, the pulse survey dashboard places greater emphasis on trend development, ad hoc topics, monitoring the current mood, eNPS, openness to job offers, and collecting specific suggestions for improvement.
3. AI Executive Summary and Recommendations with Human Oversight
The biggest leap forward is the integration of AI. In our reports, it generates a comprehensive executive summary that includes:
- An overview of the results in a few sentences.
- Clearly named strengths and more critical topics.
- A precise identification of groups at risk of turnover.
- A proposal for specific action steps, including their logical rationale and prioritization.
All recommendations include direct links to the specific data in the report.
Security First and the Human Factor
We are technologically agile, which is why we currently build our solution on various LLM models. We can work with both the best-known American providers and purely European solutions that meet the strictest security standards. Data security and the quality of evaluation are our absolute priorities. In line with the requirements of the AI Act, the summary is reviewed by an HR consultant and can be edited freely.
4. Advanced Work with Data: Filters, Memory, and Detail as Needed
The interactivity of the reports is reflected in details that help users better understand what is happening in the company or in a specific part of it.
- Smart filtering and sorting: Do you want to compare only three specific teams? A few clicks are enough to hide everything else. You can restore the default view with a single button.
- Browser memory: If you filter the report in any way or set a specific view, the browser remembers it. When you open the link tomorrow or in a week, you will see exactly the same view where you left off.
- Contextual details through hover effects: Comparison tables are not just dry numbers. Simply hover over a value in the table, and more detailed information will immediately appear—the exact ratio of positive, negative, and neutral attitudes. For turnover, you will also see the absolute number of respondents, so you immediately know how many people are actually considering leaving.
Take Survey Reporting to the Next Level
The new interactive dashboards and AI analyses in TCC online turn HR data into a strategic partner for management. Do not let valuable employee opinions disappear in the dust of static folders.
Author: Marta Fabiánová